Single Family Home Sales Statistics
Land Sales Statistics
Overall Market View
February Home Sales Decline
February is typically one of the slower months in real estate sales for the Highlands/Cashiers area. This February proved to follow the yearly real estate trend. However, this February was a decline from 2015.
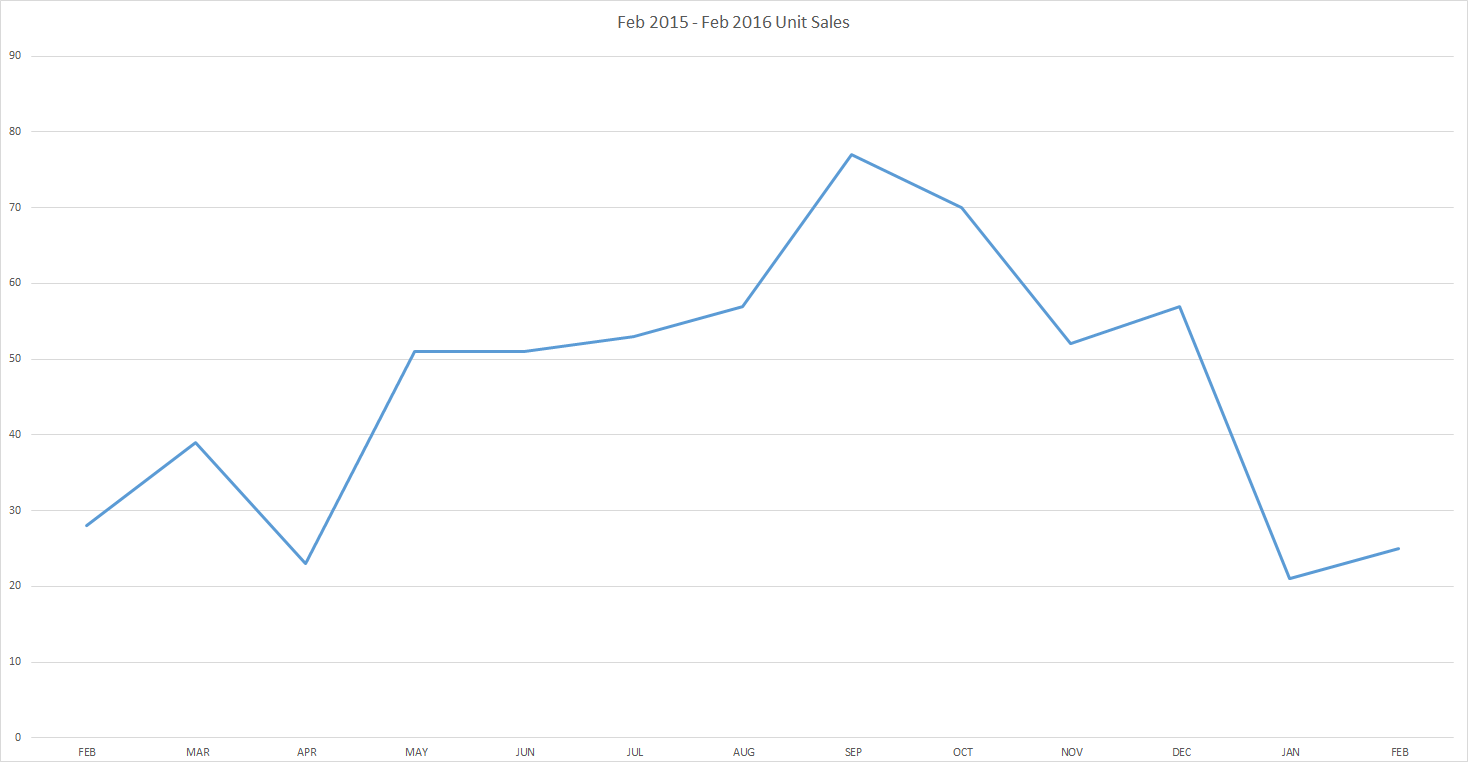
Still, when looking at the data from the Year Over Year (YOY) numbers, we should start to see an increase in sales as we head into the 2016 “Selling Season.” Indicators, such as the number of people that have been showing up in town, are impressive. If you are looking to sell your home during the 2016 “Selling Season” you may want to discuss your options to improve your chances of selling.
HOW CAN I GET MY HOME SOLD?
Pricing is everything. The buyers still appear to be in control of this market. Many brokers are still trying to get at or near assessed values of properties. However, that strategy may not be what works best for you.
The following chart shows where homes have been listed (orange block), where homes have actually sold or closed (gray block) and where the homes were assessed (yellow block).
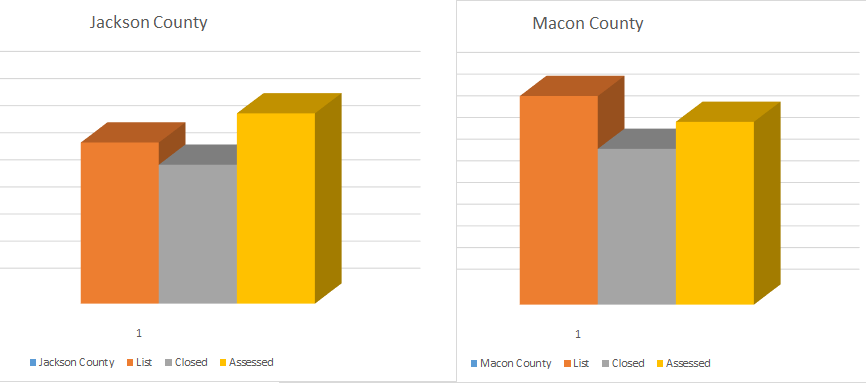
Sellers need to be realistic in the pricing of their home. Pricing your home higher than what the market allows means your home will probably just stay on the market. Buyers know the market and are not willing to pay more just because that’s what the Seller would like to get. A good broker is not one that tells you what you may want to hear. A good broker is one that shows you what the market is doing and gives you information so you can make an informed decision.
SINGLE FAMILY HOME SALES (FEBRUARY 2016):
Total homes listed in Highlands/Cashiers MLS: 1134 – Expect this number to rise in the coming months.
Homes Sold This Month: 25
Average Sales per Month 1 Year Average: 47
Inventory: 24 months – This is determined using the Average Sales Per Month, as this market is very seasonal. This number continues to be in excess of what is considered a “healthy” market.
DOM: 483 – This number will remain high until inventory is reduced..
Average DOM (YOY): 467 – This is the yearly average for DOM. Homes are selling, but not as fast as they are being replaced.
Median Sales Price: $200,000– This was a significant drop in price. This is what we may consider to be the “sweet spot” of the market. Homes around this number typically have a better rate of selling.
Average List/Sell Ratio: 88.41% -This is another indicator that homes are still considered as overpriced. If you are serious about selling your home, talk to your broker. Many feel that since people want a bargain, they are going to ask for a lower price. However, people that are already priced well stand to gain the sell of their homes.
Synopsis: We have a narrow selling season. One should not go into the season only to miss out and have their homes listed another year. Price right to take advantage of getting your home sold this season. Do not wait to see what the market will do, It may be too late. Have an aggressive strategy, if you want to see your home sold.
LAND SALES (FEB)
Land Units Sold: 14 – This is a 100% increase in land sales!!! Still, keep things in perspective. It’s only 14 unit sales in all of the MLS with over 200 brokers. That is, approximately only 1 in 15 brokers sold any land during the month. Not really good odds for land sales.
Total listed in all MLS: 1127
Inventory: 80 months. That’s 6.5 years of inventory. Are you willing to wait that long for your property to sell?
Synopsis: There is no real demand for land. The market is driven by ‘Supply and Demand.” If there is no demand, there is very little perceived value, regardless of tax assessment, etc. Remember, tax assessment is for county revenue.
Overall Market View:
52% of home sales ranged from $200,000 to $499,999.
8% of home sales ranged from $500,000 – $749,999.
12% of sales were above $1,000,000. This was good news for higher end home sales.
Sellers, if you want your home sold this season, consider being aggressive. A delay at this time could mean just another year on the market
Buyers, be prepared to take advantage of any deals offered. Homes priced properly do not last. Make sure your broker knows what you are looking for so he can alert you to price changes and new offerings. Make sure he knows your maximum budget. You may be able to get a whole lot more without having to pay a lot more.
If you’re considering listing your home for sale or purchasing a home in NC, please feel free to contact a local agent or REALTOR®. He will make a specific report for your area in our MLS (Sapphire, Norton, Glenville, Highlands, Toxaway, Clear Creek, Breedlove, etc). You can then make an informed decision on how to sell or buy your home.